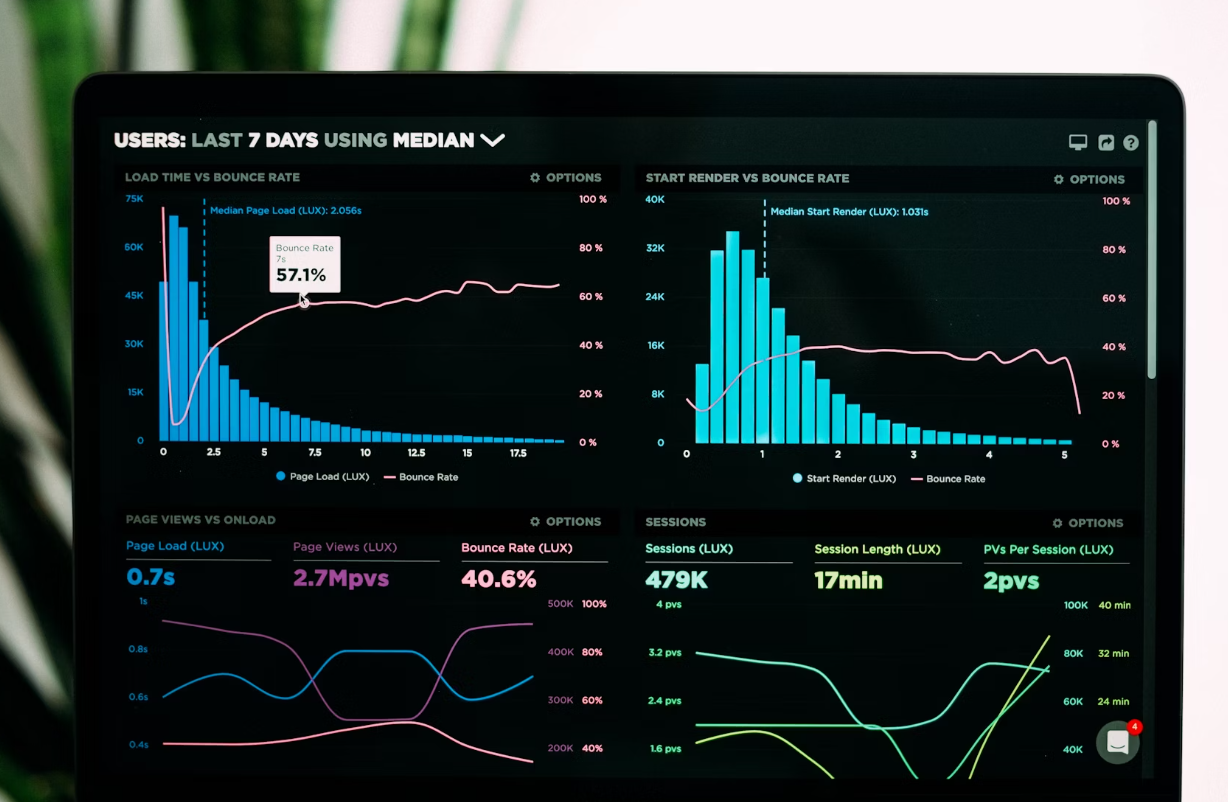
See below for examples of interactive business intelligence
dashboards I've created, all using open source data.
Tableau Dashboards
The following are examples of dashboards I've created using Tableau, all live and hosted on Tableau Public.
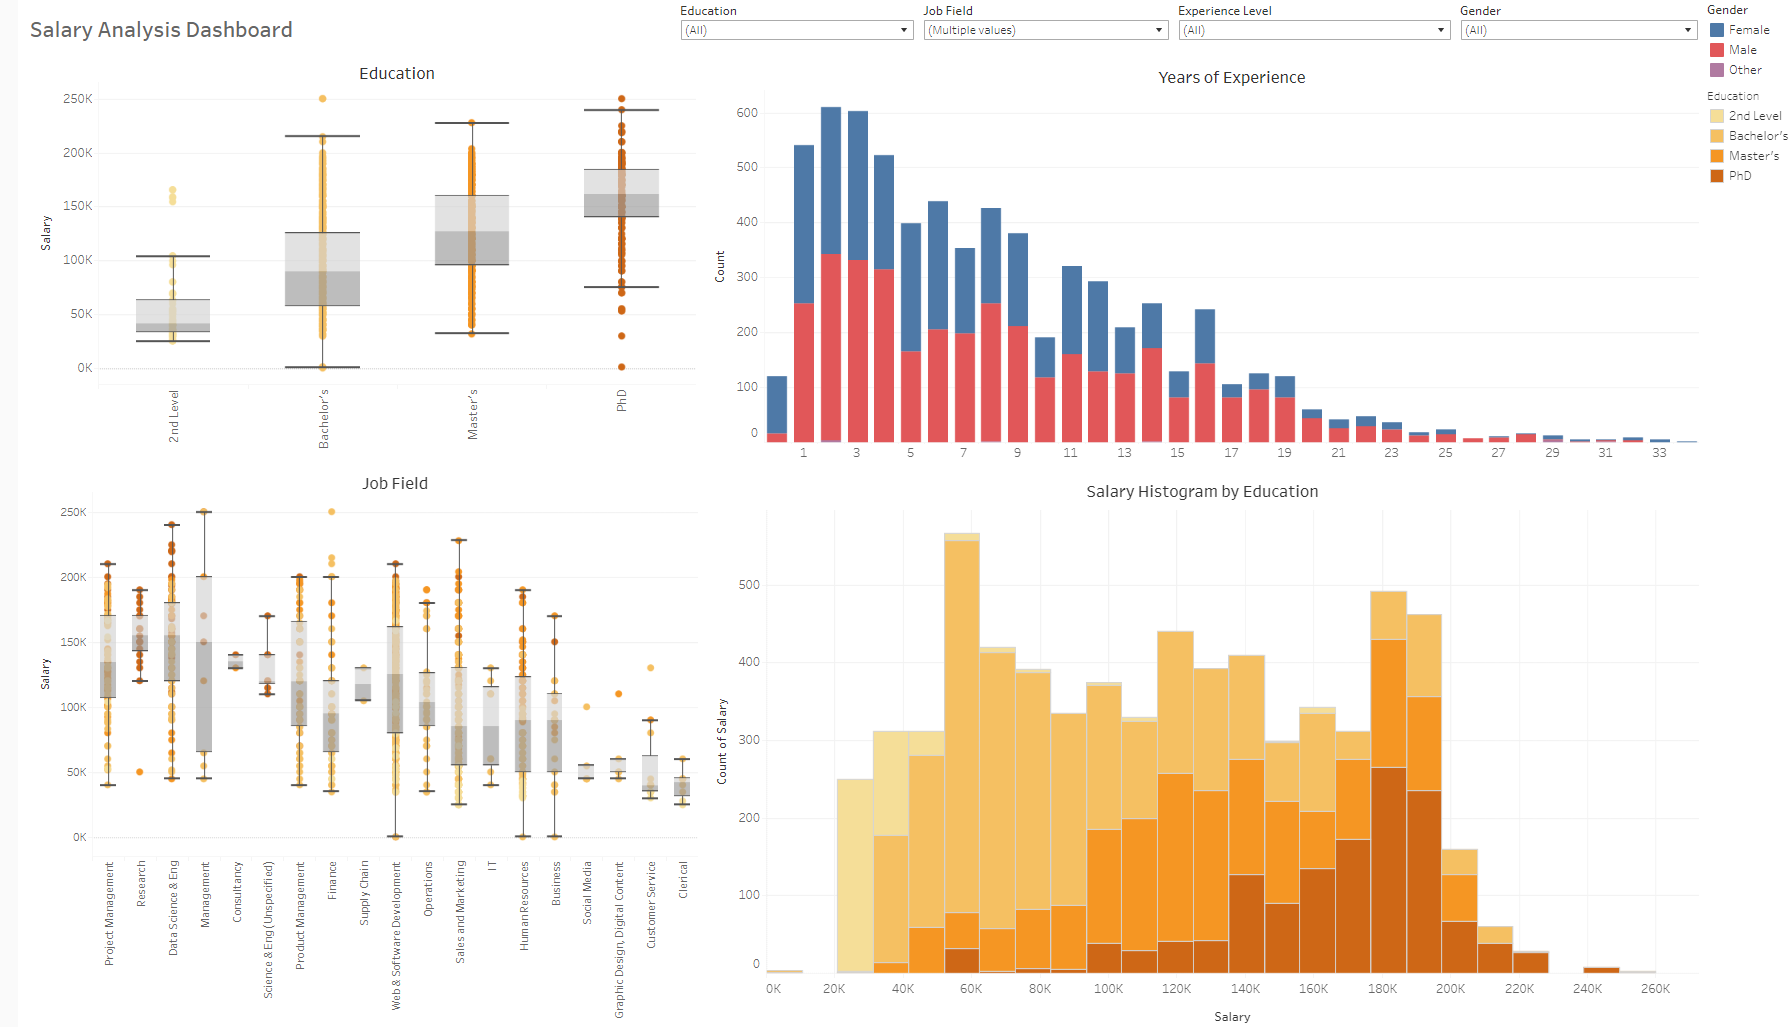
HR Salary Analysis
A dashboard showing a breakdown in salary across gender, education, job field and experience level. Data is taken from a small sample of Glassdoor responses (from Kaggle, kaggle.com/datasets/mohithsairamreddy/salary-data)
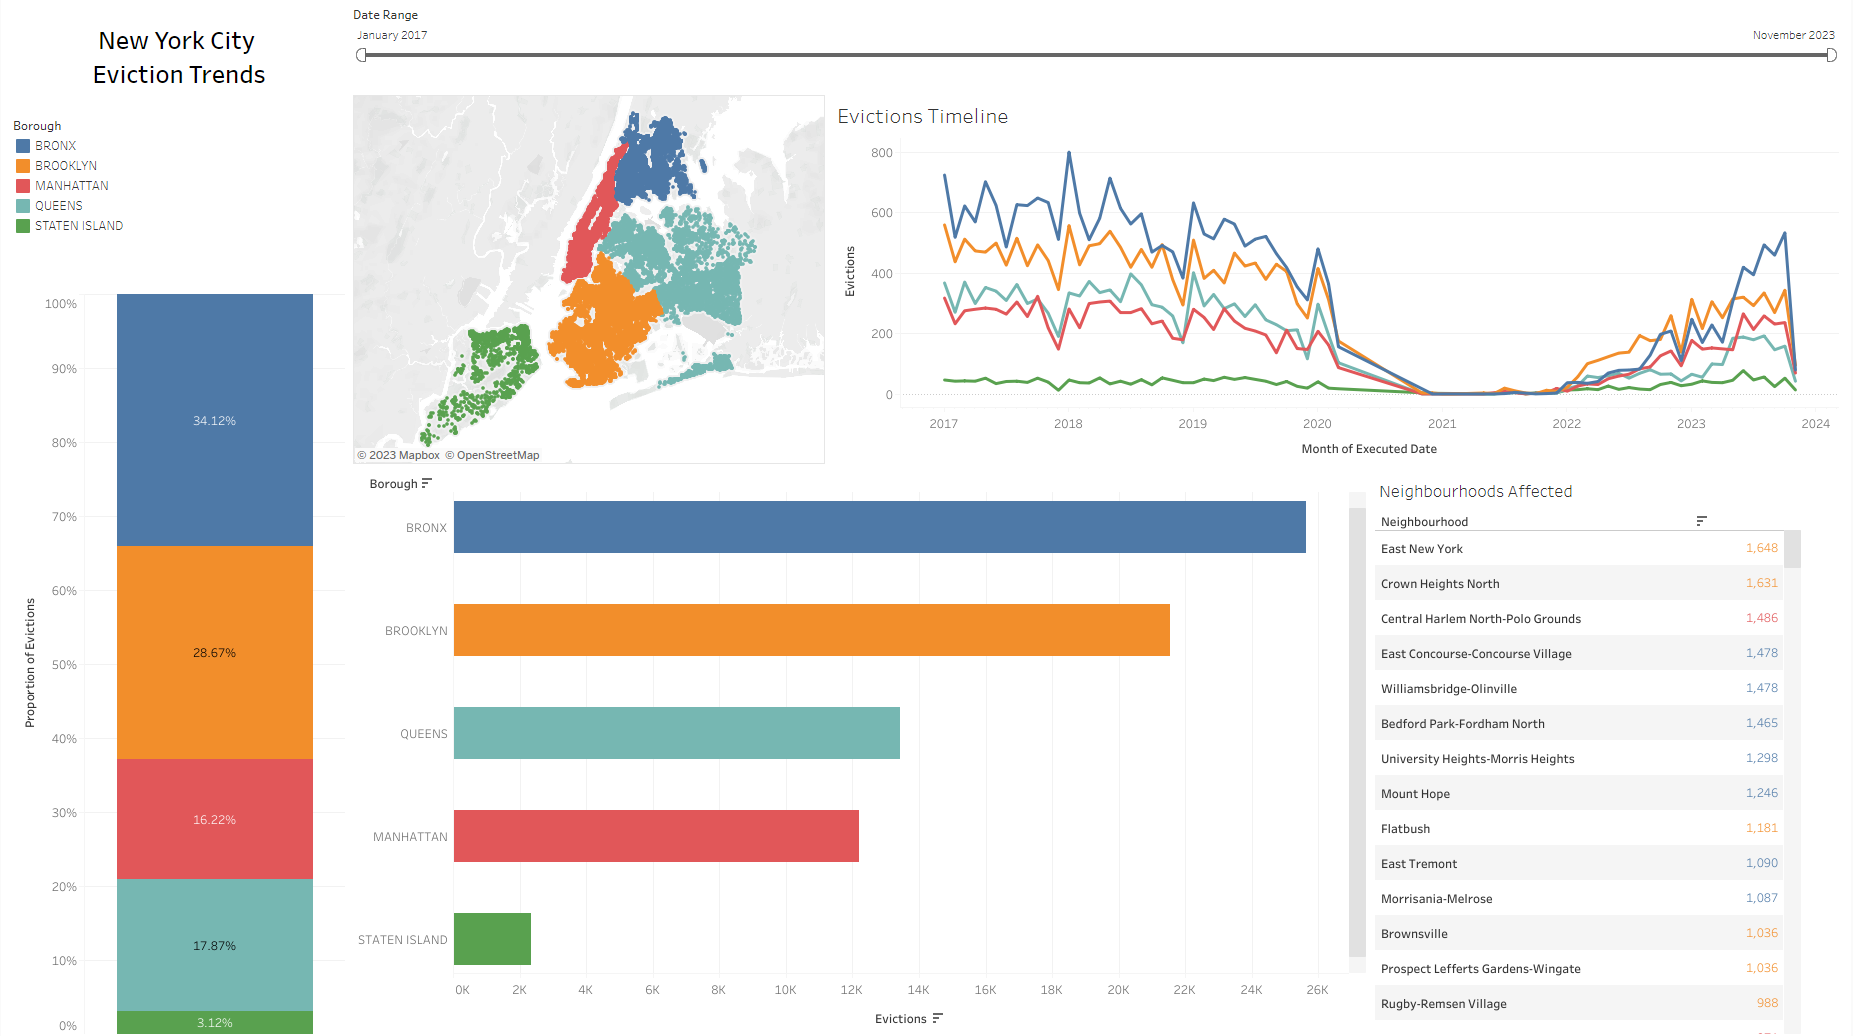
New York Eviction Trends
Trends in evictions rates for the five Boroughs in New York, including neighbourhoods most affected. Data is sourced from the NYC Open Data portal (data.cityofnewyork.us), with minimal edits for accuracy and clarity.
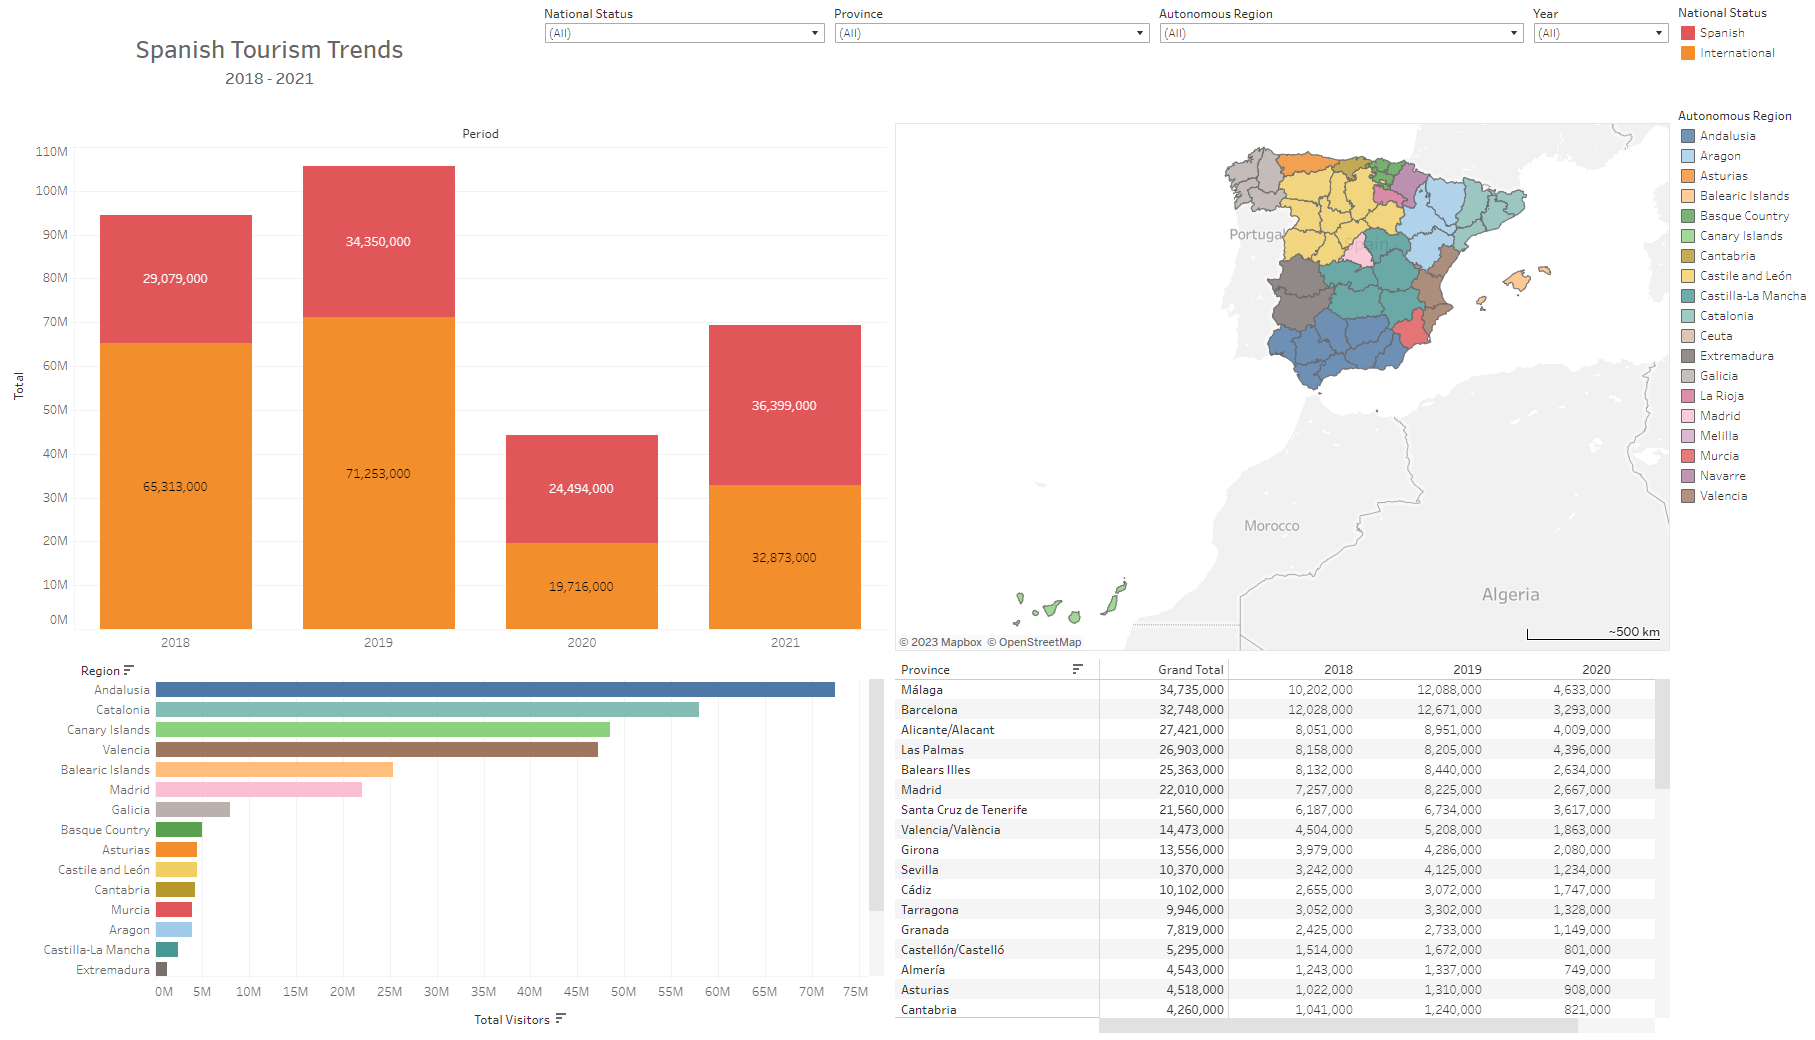
Spanish Tourism Trends
Trends in Spanish tourism for the years 2018 to 2021, at the Region and Province level. Data is sourced from the Spanish Government's Open Data portal (datos.gob.es)